

How well is your law firm performing? Have your fees kept up with inflation? The Legal Trends Report tracks small firm hourly rates and key productivity indicators, along with emerging trends in the profession. Here are highlights from the 2024 report.
Table of contents
To get up-to-date information from Clio on your state and practice area situation, check out the Clio Hourly Rates Calculator, and read the latest Legal Trends Report at www.clio.com.
What Is the Legal Trends Report?
Since 2016, Clio’s annual Legal Trends Report has been a treasure trove of practice management benchmarking data for U.S. solo and small firm practitioners. In more recent years, with the expansion of the practice management software company’s customer base, it has also become a valuable data source for midsize law firms.
Now in its ninth year, the Trends Report is an ongoing research initiative that, according to Clio, “tracks key trends in practice management, client expectations, technology adoption, and more across the U.S. legal industry.” Recent reports have focused on client service benchmarks and legal marketing, and the 2024 report features a deep dive into artificial intelligence.
However, this article focuses on the data topic that put the Legal Trends Report on the map when it debuted in 2016: small firm hourly billing rates and productivity metrics.
So, let’s dig in.
Tracking Key Productivity Indicators
Scroll to the end of the Legal Trends Report to the section on “Billable Hours and Productivity Indicators,” and you’ll find a mass of anonymized, aggregate data from tens of thousands of U.S.-based Clio customers, collected from the Clio platform. (While the exact number of platform users isn’t given, according to the company, approximately 150,000 users are on the platform worldwide.)
In addition to billing trends by state and practice area, the report provides impressive data on law firms’ overall productivity, efficiency, revenue generation and cash flow. It does so using four key performance indicators based on how you manage your business.
- Utilization rate measures how much time is spent doing billable work during an eight-hour day. At 37%, the average rate was up 2% in 2024, compared with 35% in 2023 and 30% five years ago in 2019.
- Realization rate tracks how much of that time is actually billed. At 88%, the average rate was up slightly from 86% in 2023 and 81% five years ago in 2019.
- Collection rate tracks how much of that bill the client pays. At 91%, the average rate was up 1% in 2024, compared with 90% in 2023 and 88% five years ago in 2019.
- Lockup rate measures how many days your firm’s revenue is “locked up” in an unbilled or uncollected state over the year. The report tracks three lockup metrics: realization, collection and total lockup. In 2024, the average realization was 46 days, the collection realization averaged 28 days, and the total number of lockup days was 97 days. For more on what this means and how to apply it, read “Lockup: A New Metric to Monitor Law Firm Cash Flow.”
For this article, we’ll skip further analysis of the latest utilization, realization and collection rates, except to say there has been steady improvement over the past eight years. While there were stutters due to the COVID crisis, collection rates, in particular, have shown marked improvement. Of course, the survey group is made up of Clio users, and lawyers who commit to using practice management software are likely to reap the benefits of automating their business processes. If not, there are larger issues at play.
Still, since the Trends Report was first published, Clio has worked hard to convince lawyers that focusing on incremental improvements to their systems — such as increasing the hours they spent on billable work during the day, billing more of that time, and reducing the number of days it took to collect on outstanding bills — could have an outsized impact on their overall success. Watching productivity indicators improve year over year is not a small victory.
The report includes tables with each state’s average utilization, realization and collection rate, and we urge you to study the results and absorb the authors’ suggestions. Analyzing how your practice compares to the averages and monitoring your own metrics can inspire some of those small adjustments that can improve your practice’s health and viability.
Understanding Lawyer Hourly Rates
Lawyer hourly rates are a fundamental billing structure law firms use to charge clients for their legal services. These rates are calculated based on the time a lawyer spends working on a case, and they can vary widely depending on several factors. The lawyer’s experience, location and the type of law practiced all play significant roles in determining the hourly rate. For instance, a seasoned attorney in a metropolitan area may charge a higher hourly rate than a less experienced lawyer in a rural setting. For example, look to the regions with the highest lawyer hourly rates, Washington, D.C., and Delaware, and the lowest rates, West Virginia and Montana. If you’ve traveled in these states, you know they could not be more different.
For clients, understanding lawyer hourly rates is crucial for budgeting legal fees — it helps them make informed decisions when hiring legal counsel, whether they pay hourly, use a value-based fee model or a hybrid. For law firms, the data on average billing rates by state and practice area are a good benchmark if you are considering hourly rate hikes or figuring out how to structure value-based or flat-fee billing options. Understanding what lawyers and paralegals bill in different states and practice areas — as well as the percentages rates increase (or decrease) year by year — helps law firms decide how to adjust their rates to remain competitive.
The Billable Hour Index
Clio’s Legal Billable Hour Index (below) tracks the trajectory of small firm hourly rates since the company published its first Legal Trends Report in 2016.
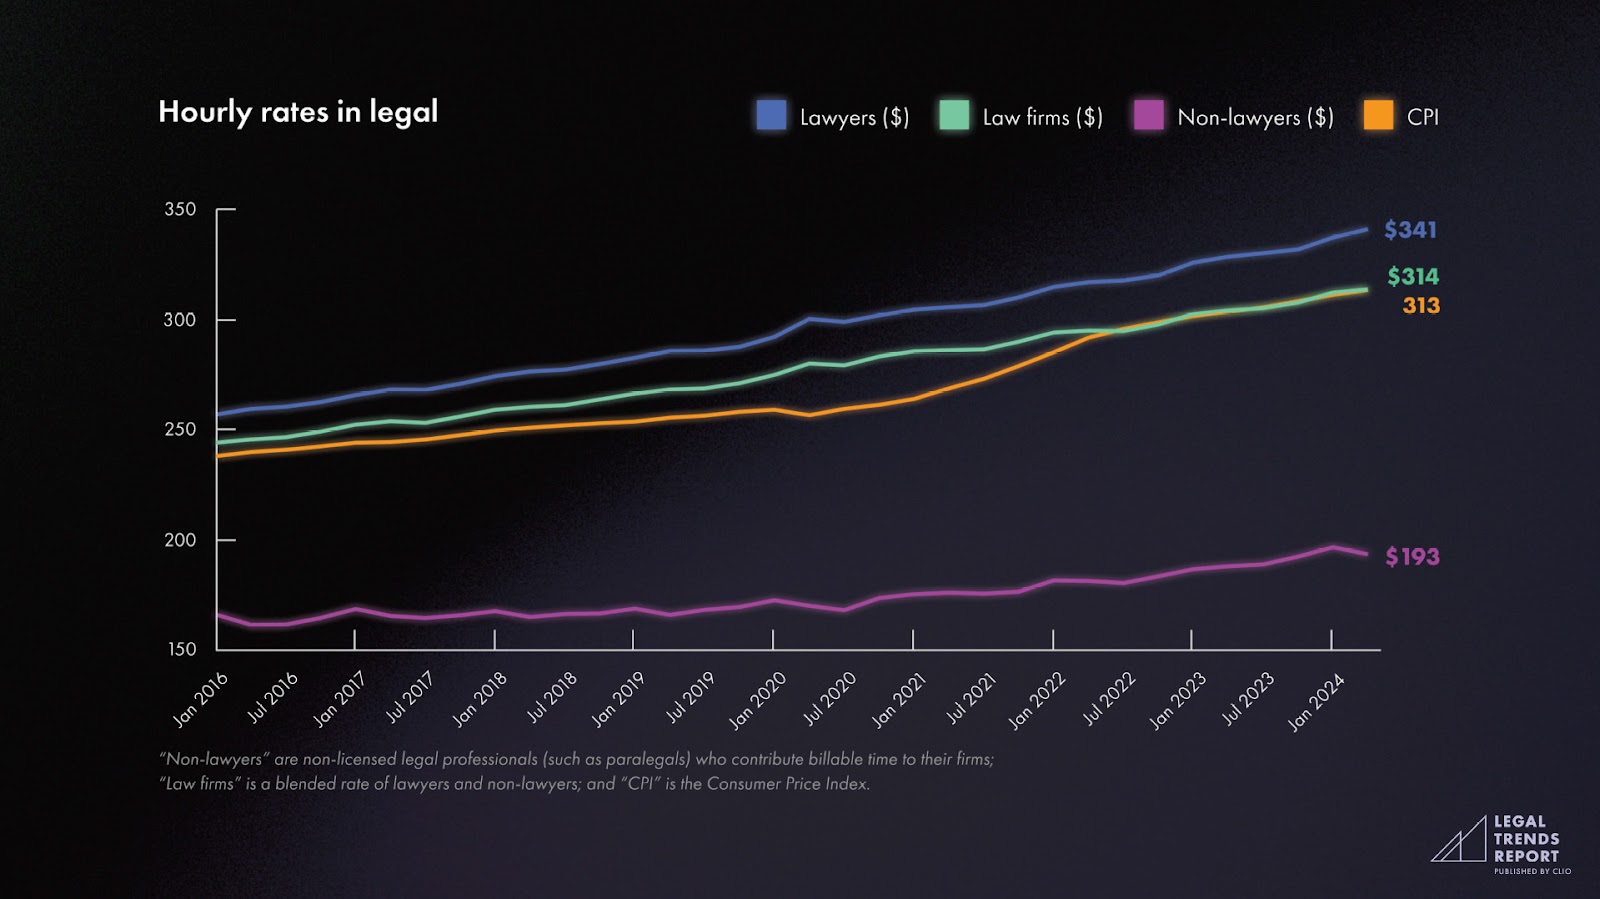
This graph’s trend lines follow three different rates:
- Lawyer hourly rate (blue), which averaged $341 per hour in 2024.
- Non-lawyer hourly rate (purple), which averaged $193 per hour in 2024.
- Blended law firm rate (green), which averaged $314 per hour in 2024.
The blended rate shows the average of what both lawyers and non-lawyers charged over this period. The yellow line shows the rate of inflation based on the Consumer Price Index.
Average Lawyer Billing Rates Surpass the CPI
As the chart shows, even with a dip in the CPI during the pandemic, average billing rates for lawyers have risen steadily, surpassing inflation, and the law firm rate has remained in step with inflation over the past two years. Non-lawyer rates for paralegals and legal professionals, however, dipped well below the CPI.
According to Clio’s Lawyer-in-Residence, Joshua Lenon, who presented the Trends Report at the Clio Cloud Conference in October, “What we see is that lawyers are actually really good about keeping hourly fees above the rate of inflation. In fact, we tend to see these average rates increase at around 4% every year.” The problem is that law firm rates, especially non-lawyer rates, aren’t keeping up with that trajectory. “If they were,” said Lenon, “lawyers would be charging less, the firm rate would be higher, and the non-lawyer rate would be much higher.”
Overall, since 2023, the average lawyer rate has increased by 4.3%, from $327 to $341, while the non-lawyer rate has increased by 8.4%, from $178 to $193. After falling below the inflation rate post-pandemic, the blended law firm rate recovered in 2023 and remained steady with inflation in 2024, increasing by 4.1% from $292 to $314.
Average Attorney Fees By State: Winners and Losers
With the average hourly billable rate for lawyers on the upswing in recent years, even lawyers in states with the lowest average hourly rates saw rate increases between 8% (New Mexico) and 25% (Iowa). Last place, West Virginia, saw lawyer rates increase 20%, from $162 to $195.
Lawyer Hourly Rates by State: 2024
| RANK | STATE | LAW FIRM RATE | 2024 LAWYER RATE | 2024 NON-LAWYER RATE | % FIRM RATE CHANGE FROM PAST YEAR | % LAWYER RATE CHANGE FROM PAST YEAR | Law Firm % Change from 2020 |
|---|---|---|---|---|---|---|---|
| No. 1 | DC | $427 | $462 | $201 | 17.0 | 17.9 | 24.9 |
| No. 2 | DE | $391 | $423 | $207 | 26.9 | 23.0 | 34.4 |
| No. 3 | NY | $374 | $398 | $223 | 10.3 | 11.2 | 10.7 |
| No. 4 | CA | $360 | $391 | $234 | 15.0 | 13.7 | 16.9 |
| No. 5 | CT | $347 | $384 | $209 | 10.5 | 12.3 | 19.7 |
| No. 6 | VA | $327 | $351 | $199 | 19.8 | 19.0 | 23.9 |
| No. 7 | IL | $328 | $349 | $200 | 14.7 | 14.4 | 17.1 |
| No. 8 | NJ | $329 | $348 | $194 | 13.1 | 13.7 | 10.0 |
| No. 9 | TX | $308 | $345 | $177 | 16.7 | 15.0 | 21.7 |
| No. 10 | MD | $344 | $344 | $214 | 20.3 | 11.0 | 19.9 |
| No. 11 | GA | $315 | $340 | $193 | 20.2 | 18.9 | 25.0 |
| No. 12 | FL | $304 | $335 | $183 | 15.2 | 12.8 | 16.0 |
| No. 13 | NV | $301 | $330 | $181 | 6.4 | 6.1 | 7.5 |
| No. 14 | WA | $290 | $322 | $173 | 12.4 | 11.8 | 15.5 |
| No. 15 | MA | $305 | $318 | $249 | 11.7 | 11.6 | 18.7 |
| No. 16 | RI | $303 | $317 | $184 | 29.5 | 32.1 | 57.8 |
| No. 17 | HI* | $293 | $312 | $164 | – | – | – |
| No. 18 | MN | $283 | $305 | $162 | 13.2 | 12.5 | 15.0 |
| No. 19 | PA | $288 | $302 | $197 | 5.9 | 4.9 | 7.5 |
| No. 20 | CO | $279 | $302 | $169 | 18.2 | 15.7 | 18.7 |
| No. 21 | AK* | $272 | $300 | $178 | – | – | – |
| No. 22 | OR | $267 | $296 | $150 | 16.1 | 16.1 | 19.7 |
| No. 23 | NC | $271 | $295 | $158 | 18.3 | 16.1 | 21.0 |
| No. 24 | NH | $281 | $294 | $206 | 22.2 | 18.5 | 16.1 |
| No. 25 | MI | $269 | $294 | $138 | 8.0 | 10.5 | 8.9 |
| No. 26 | KS | $277 | $292 | $168 | 30.0 | 28.6 | 31.9 |
| No. 27 | UT | $271 | $291 | $160 | 17.3 | 16.4 | 2.7 |
| No. 28 | WY | $266 | $290 | $128 | 18.8 | 20.3 | 14.2 |
| No. 29 | SC | $256 | $287 | $139 | 17.4 | 15.3 | 23.1 |
| No. 30 | AZ | $261 | $287 | $144 | 7.9 | 7.9 | 14.5 |
| No. 31 | ND | $266 | $285 | $180 | 15.2 | 12.6 | 13.7 |
| No. 32 | TN | $260 | $281 | $149 | 19.3 | 20.6 | 22.6 |
| No. 33 | MO | $262 | $280 | $154 | 15.4 | 12.4 | 21.3 |
| No. 34 | WI | $269 | $278 | $158 | 22.8 | 20.3 | 21.2 |
| No. 35 | IN | $264 | $278 | $174 | 17.3 | 14.9 | 21.1 |
| No. 36 | AR | $252 | $271 | $168 | 10.0 | 12.0 | 14.5 |
| No. 37 | OH | $255 | $268 | $181 | 20.3 | 19.6 | 19.7 |
| No. 38 | VT | $251 | $267 | $145 | 16.2 | 18.1 | 20.1 |
| No. 39 | ID | $249 | $267 | $141 | 14.2 | 14.6 | 20.3 |
| No. 40 | LA | $244 | $266 | $113 | 8.0 | 8.6 | 11.4 |
| No. 41 | NM | $237 | $261 | $143 | 8.2 | 7.9 | 9.7 |
| No. 42 | OK | $242 | $257 | $131 | 11.0 | 9.4 | 17.5 |
| No. 43 | NE | $251 | $256 | $230 | 15.7 | 17.4 | 18.4 |
| No. 44 | IA | $241 | $254 | $166 | 24.9 | 25.7 | 41.8 |
| No. 45 | AL | $233 | $246 | $143 | 19.5 | 18.3 | 25.3 |
| No. 46 | SD | $237 | $245 | $154 | 21.5 | 23.1 | 35.4 |
| No. 47 | MS | $228 | $242 | $158 | 14.6 | 11.5 | 19.4 |
| No. 48 | ME | $229 | $236 | $181 | 25.1 | 22.3 | 42.2 |
| No. 49 | KY | $227 | $236 | $158 | 17.6 | 15.7 | 15.8 |
| No. 50 | MT | $220 | $234 | $132 | 17.6 | 17.6 | 20.2 |
| No. 51 | WV | $192 | $195 | $197 | 20.0 | 20.4 | 16.4 |
The Legal Trends Report analyzed data from 50 states, including Alaska and Hawaii, plus the District of Columbia.
At $195, West Virginia is the only state with an average lawyer billing rate below $200, demonstrating the significant disparities in legal fees based on geographical location. Less than 300 miles northeast, Washington, DC, has the highest average lawyer billing rate at $462. Delaware was the only other state or region to surpass the $400 threshold, ranking No. 2 at $423.
Still, more than 30 states have an average law firm billing rate that is below the $314 average 2024 blended rate and the $313 CPI rate.
Fortunately, no state’s average hourly rate decreased in 2024.
The Top 10 States for Lawyer Hourly Rates
The top 10 jurisdictions with the highest lawyer billing rate in 2024 are:
- District of Columbia ($462)
- Delaware ($423)
- New York ($398)
- California ($391 )
- Connecticut ($384)
- Vermont ($351)
- Illinois ($349)
- New Jersey ($348 )
- Texas ($345)
- Maryland ($344)
Conventional wisdom and past data tell us that geographic centers with high hourly rates, like D.C., Delaware and New York, are better able to increase their rates. That makes sense since their clients are accustomed to annual rate increases. However, as demand for legal services ramped up during the pandemic and firms scrambled to keep up with rising inflation, rates increased across the legal landscape, not just among the top tier. Given current economic conditions that trend is not likely to end.
The states with the largest increases in rates include Rhode Island, at $317, up 34.8% from the previous year; Kansas, at $292, up 28.6%; and 44th-ranked Iowa, at $254, up 25.7%. Only six states saw increases below 10%.
The Bottom 10 States for Lawyer Hourly Rates
The 10 states with the lowest average hourly rates are, from lowest to highest:
- West Virginia ($195) (51st)
- Montana ($234) (50th)
- Kentucky ($236) (49th)
- Maine ($236) (48th)
- Mississippi ($242) (47th)
- South Dakota ($245) (46th)
- Alabama ($246) (45th)
- Iowa ($254) (44th)
- Nebraska ($256) (43rd)
- Oklahoma ($257) (42nd)
Tracking Hourly Rate Data by Practice Area
Which practice areas have the highest and lowest rates? Clio tracks the average billing rates in 30 different practice areas, and here’s where we see the real impact of the trailing pandemic effect and the economy.
Hourly Rates by Practice Area: 2023-2024
| RANK | PRACTICE | 2024 LAWYER RATE | 2024LAW FIRM RATE | 2024 NON LAWYER RATE | FIRM % CHANGE FROM 2023 | LAWYER % CHANGE FROM 2023 | FIRM % CHANGE FROM 2020 |
|---|---|---|---|---|---|---|---|
| No. 1 | Bankruptcy | 439 | 391 | 214 | 5.37 | 2.51 | 21.99 |
| No. 2 | Intellectual Property | 414 | 393 | 264 | 4.07 | 1.45 | 17.56 |
| No. 3 | Corporate | 407 | 388 | 213 | 3.09 | 1.72 | 18.81 |
| No. 4 | Immigration | 394 | 357 | 316 | 7.56 | 4.82 | 19.61 |
| No. 5 | Tax | 382 | 350 | 239 | (5.43) | (7.07) | 15.71 |
| No. 6 | Trusts | 380 | 333 | 201 | 2.70 | (0.26) | 17.42 |
| No. 7 | Commercial | 365 | 347 | 183 | (3.46) | (3.56) | 9.51 |
| No. 8 | Employment/Labor | 362 | 335 | 169 | (4.48) | (4.14) | 9.55 |
| No. 9 | Real Estate | 354 | 335 | 193 | 2.09 | 0.00 | 17.31 |
| No. 10 | Wills & Estates | 351 | 313 | 196 | 5.43 | 1.99 | 18.53 |
| No. 11 | Business | 346 | 330 | 186 | 2.12 | 1.45 | 13.64 |
| No. 12 | Contracts | 341 | 347 | 183 | 10.09 | 3.23 | 22.77 |
| No. 13 | Mediation/Arbitration | 338 | 318 | 142 | 3.14 | (0.59) | 9.75 |
| No. 14 | Civil Rights/Const. | 330 | 300 | 150 | (1.00) | 0.00 | 5.33 |
| No. 15 | Civil Litigation | 327 | 305 | 162 | 1.97 | 0.61 | 12.79 |
| No. 16 | Collections | 320 | 286 | 192 | 6.99 | 4.69 | 15.38 |
| No. 17 | Elder Law | 320 | 291 | 195 | 10.65 | 9.38 | 24.74 |
| No. 18 | Family | 314 | 283 | 168 | 3.53 | 0.64 | 16.25 |
| No. 19 | Administrative | 311 | 257 | 140 | 0.00 | 1.93 | 8.95 |
| No. 20 | Appellate | 309 | 297 | 192 | 3.70 | 1.29 | 15.49 |
| No. 21 | Personal Injury | 309 | 271 | 161 | 9.96 | 9.39 | 22.14 |
| No. 22 | Traffic Offenses | 300 | 305 | 348 | 6.23 | (6.00) | 20.00 |
| No. 23 | Construction | 277 | 248 | 133 | 2.82 | 2.89 | 4.84 |
| No. 24 | Government | 259 | 254 | 187 | (3.94) | (5.79) | 10.63 |
| No. 25 | Insurance | 243 | 229 | 123 | 8.30 | 5.76 | 12.66 |
| No. 26 | Medical Malpractice | 238 | 208 | 121 | (1.44) | (1.26) | 5.77 |
| No. 27 | Criminal | 216 | 215 | 202 | 3.26 | 2.31 | 23.26 |
| No. 28 | Small Claims | 209 | 202 | 122 | 12.87 | 7.18 | (1.98) |
| No. 29 | Workers’ Compensation | 177 | 169 | 131 | 0.59 | 1.13 | 7.69 |
| No. 30 | Juvenile | 136 | 138 | 187 | 9.42 | 6.62 | 36.96 |
Keeping in mind the average lawyer billing rate of $314, in 2024, 17 practice areas billed $314 or higher, and 22 billed above the $300 mark. Only two practice areas fell below $200 per hour.
The Top 10 Practice Areas
In 2024, the 10 practice areas where lawyers charged the highest average rates were:
- Bankruptcy
- Intellectual Property
- Corporate
- Immigration
- Tax
- Trusts
- Commercial
- Employee/Labor
- Real Estate
- Wills and Estates
Picking Up the Rear
The lowest hourly rates are $162 and below. Again, it seems that many lawyers still put stock in knowing how sensitive clients are to ceiling rates. The practice areas wrapping up the bottom of the chart, starting with the lowest, are:
- Juvenile
- Workers’ Compensation
- Small Claims
- Criminal
- Medical Malpractice
- Insurance
- Government
- Construction
- Traffic Offenses
- Personal Injury
If you want to dig further into the data, download Clio’s most recent Legal Trends Report here.
Thanks to Susan Kostal for authoring previous editions of this article.
Image © iStockPhoto.com.
Sign up for Attorney at Work’s daily practice tips newsletter here and subscribe to our podcast, Attorney at Work Today.
Illustration ©iStockPhoto.com
Subscribe to Attorney at Work
Get really good ideas every day for your law practice: Subscribe to the Daily Dispatch (it’s free). Follow us on Twitter @attnyatwork.