


Feeling like the big firms are eating your lunch?
As the rate gap widens are you feeling like the big firms are eating your lunch? That’s because they are. CounselLink trends report on corporate legal spending.

Table of contents
LexisNexis CounselLink released its sixth annual trends report today on corporate legal department spending, and there are some interesting highlights about where work is going, what companies are willing to pay for premium work, and what median billing rates are by law firm size, practice area and geography.
Perhaps the most telling statistic is the cavernous “rate gap” between what the largest law firms charge and what smaller firms can command — a gap that continues to widen. According to the report, firms with more than 750 attorneys have billable rates that are 53% higher than rates at the next tier of firms, those with 501 to 750 lawyers. This compares with a 45% gap reported in 2017, and a 40% gap in 2016.
The trends report is based on data from CounselLink, an enterprise legal management and e-billing platform used by corporate law departments. CounselLink tracked more than $33 billion in legal spend, comprising approximately 7 million invoices and approximately 1.7 million matters. The report’s key metrics are based on 12 months of charges (April 30, 2018, through April 30, 2019) billed by outside counsel.
Consolidation at the Top
Not only is the high-rate work dominated by the largest firms, but they are also getting more of it every year. The largest law firms (the “top 50”) had a 57% share of the work in 2018-19 compared with a 50% share in 2016. What’s more, companies are spending more of their dollars with fewer law firms. According to the CounselLink data, 61% of companies have 10 law firms or fewer that account for at least 80% of their outside counsel spend. This seems to point to entrenched providers getting more work.
“Corporate counsel are moving toward having a smaller set of law firms handle the majority of their work,” report author Kris Satkunas said in an interview.
Satkunas, Director of Strategic Consulting for CounselLink, added that in their 2013 report CounselLink noticed more high-value work going to firms of 501-750 attorneys. For example, more than 50% of high-value M&A fees were going to such firms. But that trend sputtered out. “More market share continues to go to the larger firms.”
The hitch? There doesn’t seem to be any advantage for clients to buying in bulk, as it were, at least when it comes to hourly rates. From the client perspective, said Satkunas, “It’s disappointing that we are not seeing the effective rates that they are paying drop in any way. They are consolidating with the very largest law firms and are not using their negotiating strength to leverage rates down.
“There may be an assumption on their part that will happen naturally, but if they are not asking for better pricing, they aren’t going to get it,” she added.
Rising Rates Contribute to Rate Gap
Indeed, the median hourly rate continues to rise. Five major cities (San Francisco, Seattle, Detroit, New York and Washington, D.C.) show rate growth of 4% or more, over both the last year and the last three years.
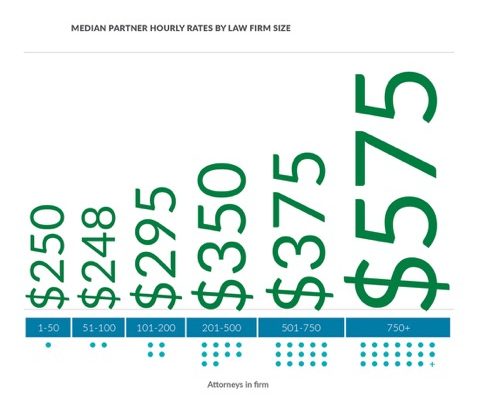
Median partner hourly rates, across all practice areas except insurance, ranged from $250 an hour for firms of 1-50 attorneys to $350 for firms of 201-500 attorneys. The huge jump comes when you look at firms with more than 500 lawyers. Firms of 501-750 attorneys have a median hourly rate of $375, while their larger counterparts, firms of 750-plus attorneys, have a median hourly rate of $575.
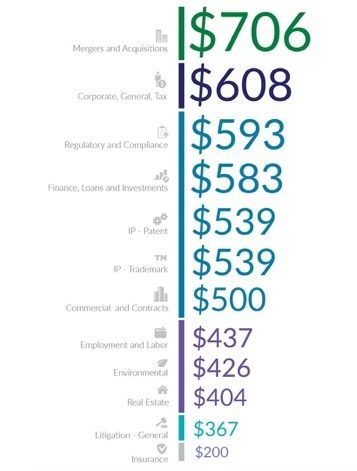
The hourly rate by practice area showed the predictably wide gap between mergers and acquisitions, at a median rate of $706 per hour, to IP at $539 an hour, and insurance at $200 per hour.
Partner rates that showed the highest increase were for M&A; commercial and contracts; corporate, general and tax; regulatory and compliance; and IP patent work, which each grew by 4 % or more, both over the last year and the last three years. (Related: “Beyond the Net Promoter Score: Clio Annual Trends Report.”)
Alternative Fee Arrangements on the Rise … But Not So Fast
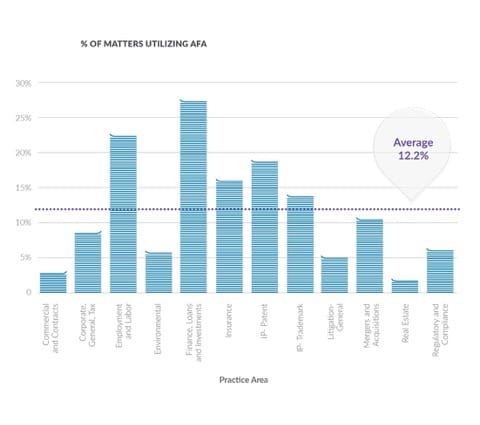
Use of alternative fee arrangements (AFAs) is growing, but probably not as fast as one would think for all the discussion and attention it gets. After hovering just under 10% for years, the percentage of matters that include a non-hourly billing component is now 12.2%. Still, the report says the data continues to show high-cost matters, or portions of them, being billed under some form of AFA — so, considering the actual dollar amounts at stake, the growth in alternative arrangements is significant, Satkunas said. The report notes that commodity work in the insurance; IP-patent; IP-trademark; employment and labor; and finance, loans and investments categories show the highest AFA billings.
In particular, the use of AFAs in finance, loans and investment work jumped considerably from last year and is now at 28% of billings. In employment and labor, more than 20% of matters were billed under an AFA.
There’s plenty more in the report for number-crunchers and anyone trying to benchmark their rates in their market to pick apart, including data on blended rates, rates for partners, associates and paralegals (broken down by practice area), and which practice areas have the most consistent rates, meaning they are less subject to negotiations between companies and outside counsel, and which have higher volatility.
The full CounselLink trends report is available here. I recommend it for anyone looking for insight into what the market will bear in your particular practice area.
Note for liberal art majors:
The median of a set of numbers is that number where half the numbers are lower and half the numbers are higher. The average of a set of numbers is the total of those numbers divided by the number of items in that set. Averages are more easily skewed by very high or very low numbers in the data set.
You Might Also Like …
“10 Rules for Surviving as a Solo or Small Firm Lawyer” by Dustin Cole
“Staying Competitive: 7 Tips from 7 Legal Marketing Pros”
“Beyond the Net Promoter Score: Clio Annual Trends Report” by Jared Correia
Illustration ©iStockPhoto.com
Subscribe to Attorney at Work
Get really good ideas every day for your law practice: Subscribe to the Daily Dispatch (it’s free). Follow us on Twitter @attnyatwork.